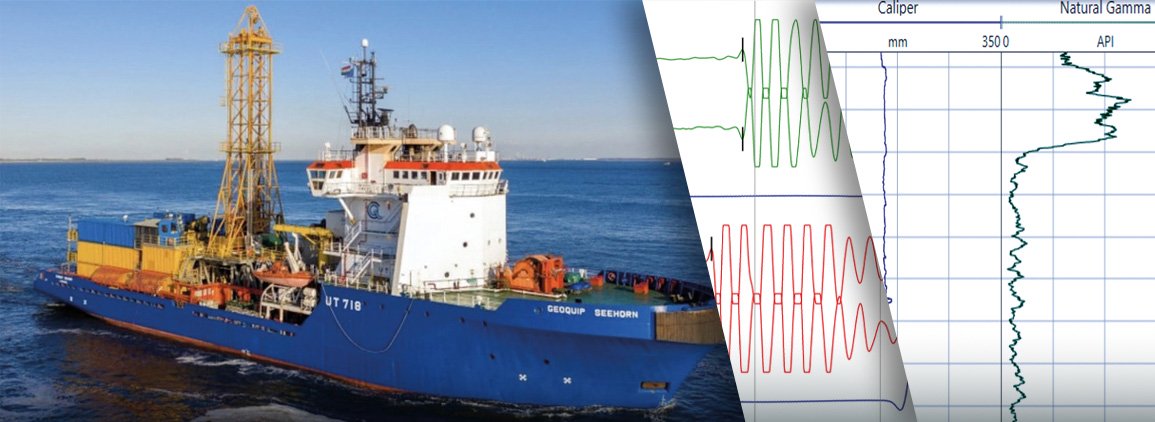
Robertson Geo Services were contracted by Geoquip Marine to join the geotechnical investigation, operating on the drill ship Seehorn, based out of Rostock, Germany. The PS Logger® and 3-Arm Caliper probes were required to log five boreholes, drilled using Geobor S, with depths to 60m over a period of three weeks.
Once the drilling was completed on each borehole the logging was conducted in multiple runs to minimise potential problems with borehole stability. The resulting data was processed on board the vessel by the engineer, with a fast turnaround, and finally QC checked by a Robertson Geo geophysicist back in the UK.
The Probes: The PS Logger® probe measured P (compression) and S (shear) wave velocities in a single borehole without the need for external energy sources, making it simple and quick to deploy. When combined with bulk density values (from sample tests conducted by the onboard laboratory) small strain moduli (Young’s, Shear and Bulk) were calculated using simple formulae.
The 3-Arm Caliper probe provides a single continuous log of the borehole diameter as recorded by three mechanically coupled arms in contact with the borehole wall. This gives a detailed profile into the integrity of the borehole wall, useful for QC when running sonic probes like the PS Logger®, as a smooth borehole wall will re-transmit a more coherent waveform. Natural Gamma was also recorded, indicating lithology changes, as radioactive elements are concentrated in some formations (clay or shale) and depleted in others (sand and chalk).
The Data: Full waveforms were recorded across six channels, two for P waves and four for S waves (left & right) at the near and far receivers. The sample rate was carefully selected to be as small as possible to provide the best resolution but high enough to capture the arrivals within the listening window. Using the acquisition software, the waveforms were be displayed, scaled and filtered to allow for the picking of the first arrivals at each receiver. Once picked and the results combined with density data, small strain moduli were derived. Upon successful completion of the logging programme a final report was prepared for the client.


